
📌 Key Takeaways
Pump failures rarely come out of nowhere; the warning signs usually appear first in trend data.
Watch Trend Changes: Rising amp draw, longer runtime, or weaker flow can show trouble before alarms fire.
Compare Against Normal: The best warning sign is a change from that station’s usual pattern.
Use History First: One odd reading means less than a steady change over days or weeks.
Check Pumps Side By Side: In duplex stations, one pump acting differently gives technicians a clear place to start.
Treat Trends As Clues: Trend data helps guide inspections, but field checks still confirm the real problem.
The pump usually speaks before it fails; good monitoring makes that message easy to see.
Lift station operators and utility teams will spot early pump warning signs faster, preparing them for the detailed overview that follows.
~ ~ ~ ~ ~ ~ ~ ~ ~ ~ ~ ~ ~ ~ ~ ~ ~ ~
The three pump data trends operators should watch first are:
Amp draw that rises, spikes, or diverges from a pump's normal pattern
Runtime or cycle history that changes without an obvious flow-related reason
GPM, wet well level, or inflow behavior that no longer matches the station's expected baseline
None of these require universal numeric thresholds to act on — they require consistent access to trend history that your monitoring system makes easy to see.
The Pump Usually Warns You Before It Fails
Lift station failures rarely feel sudden in hindsight. The high-water alarm, the weekend emergency callout, the overflow risk — those are end-state events. The warning signs were usually present earlier in the data: subtle shifts in amp draw, runtime climbing past its normal band, a pump cycling more frequently than inflow conditions explain.
The challenge is not whether the data exists. In most lift stations, pump runtimes, cycles, and alarm history are being logged in some form. The real question is whether the monitoring setup makes those patterns visible early enough for the team to investigate before conditions escalate. An alarm tells you something crossed a line. A trend shows you whether the station was drifting toward that line for days or weeks before it got there.
"A pump usually tells you it is struggling before it fails; the only question is whether your monitoring system makes that warning easy to see."
Pump data trends do not replace field judgment. They give your team a better place to start.
Why Operators Miss Early Warning Signs
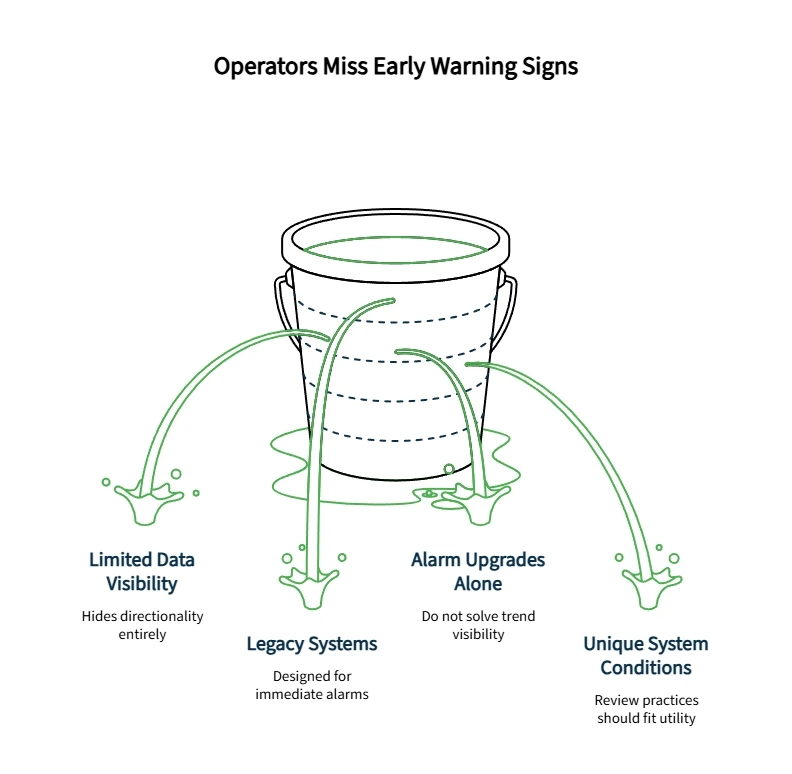
Data visibility is the operational gap most teams underestimate. Monthly or periodic reports can hide directionality entirely if they only show totals or current values rather than change over time. A report showing Pump 1 ran 214 hours last month tells you very little without knowing it ran 151 hours two months ago. The number alone is not the warning. The direction of the number is.
Legacy systems and older hardwired telemetry setups were designed primarily to surface alarms — threshold crossings requiring immediate response — not to present historical trend graphs that operators can scan during routine reviews. If a team only checks station data when a high-water alarm fires, they have already missed the earlier window for investigation.
Replacing outdated alarms is one piece of the picture, but alarm upgrades alone do not solve the trend-visibility problem. A well-configured alarm set on a system that cannot graph pump cycle history over 60 days still leaves the team blind to gradual performance degradation. Both tools matter — alarms handle acute events; trend history handles chronic degradation.
The U.S. EPA's lift station maintenance guidance connects collection system and lift station operation with reducing sanitary sewer overflow risk, which is why trend review belongs inside a practical maintenance mindset rather than a once-in-a-while reporting exercise. The EPA's CMOM guidance also emphasizes that each system has unique conditions, so review practices should fit the actual utility. The right question is not, "What universal number means the pump is failing?" The better question is, "What changed from this station's normal pattern?"
The 3 Pump Data Trends to Watch First
These three patterns most reliably signal impending trouble. Each requires access to historical trend data — not just a current reading — to be meaningful.
Amp draw that moves away from normal. Rising amp draw indicates the motor is working harder than expected. A gradual upward drift over several weeks may suggest impeller wear, bearing friction, or a developing obstruction. A sudden step-change spike is more consistent with an acute blockage — rags, wipes, or solids reaching the impeller. In either case, the pattern is a reason to dispatch, not a confirmed diagnosis.
Compare the pump against its own historical amp pattern first, then against a paired pump if the station has one. In a duplex station, Pump 1 and Pump 2 should not be treated as identical in every moment, but a persistent difference between them is a meaningful diagnostic clue. A field technician noticing that Pump 1 consistently draws higher amps while Pump 2 stays near its normal range has a clear starting point for inspection — not a final diagnosis, but a concrete reason to investigate.
Runtime or cycle history that changes without a clear flow-related reason. Longer runtime with consistent inflow often suggests reduced pump efficiency. Increased cycling can indicate a float or level control issue, a check valve problem, or a pump losing capacity. In duplex stations, comparing both pumps side by side makes interpretation far more reliable — if Pump 1 trends are stable while Pump 2 runtimes are climbing, the issue is specific to Pump 2, not a station-wide inflow event.
This is where Lift Station Monitoring becomes more than alarm notification. It gives the team a way to see whether pump behavior is steady, drifting, or becoming inconsistent. Review runtime history against wet well level, rainfall, inflow behavior, and paired pump performance together. A pump that runs longer during heavier flow may be behaving exactly as expected. A pump that runs longer without a clear flow-related reason deserves attention.
GPM or wet well level behavior that no longer matches the station's expected pattern. A pump moving less water per cycle than it did previously — even while running the same duration — is losing capacity. When level trends and pump output trends diverge from their historical relationship, that gap warrants closer attention. Cross-referencing GPM with runtime and inflow data is how operators distinguish a pump problem from a changing inflow condition.
For broader Wastewater Monitoring, this combined view helps operators separate pump questions from station behavior questions. That distinction prevents wasted inspections and sharpens dispatch decisions.
Abnormal pump trends are not automatic proof of mechanical failure. Rather, they are decision-support signals that help prioritize inspection efforts. Field judgment determines what the investigation ultimately reveals.
What a Healthy Pump Trend Looks Like Compared With a Failing One
There are four patterns operators commonly encounter when reviewing pump trend history.
The healthy baseline is relatively flat. Amp draw holds a consistent band across weeks and months. Runtime per cycle stays in a predictable range, rising with rain events and returning to baseline afterward. The line moves, but predictably.
The gradual drift is the most operationally dangerous pattern, precisely because it is the easiest to overlook. Amp draw trends upward over 60 or 90 days — not sharply, but consistently. The pump still runs. No configured alarm fires. Viewed as individual daily snapshots, nothing appears alarming. Viewed as a trend graph across two or three months, the direction is unmistakable. This is the pattern that most often precedes failures that later feel "sudden."
The step-change spike is easier to catch. Amp draw jumps sharply in a single cycle or short window, typically consistent with an acute blockage. The appropriate response is field inspection and cleaning. Importantly, reviewing whether these spikes are recurring matters — frequent step-change spikes at the same station often point to a wet well intake protection issue.
Repeated excess runtime across multiple reporting periods is the pattern supervisors should flag in weekly reviews. When a pump consistently runs past its expected cycle time as the new normal rather than an exception, schedule an inspection. Waiting for a high-water alarm to make that dispatch decision costs the team the opportunity to act at lower cost and lower risk.
Financially, improved trend visibility enables operations teams to schedule maintenance before failures occur, reducing reliance on emergency callouts and unplanned repair costs. The goal is replacing reactive firefighting with predictable, evidence-based maintenance decisions.
How Cloud-Based Monitoring Makes the Pattern Easier to See
Cellular SCADA Monitoring enables earlier anomaly detection by making pump trend history easier to access.
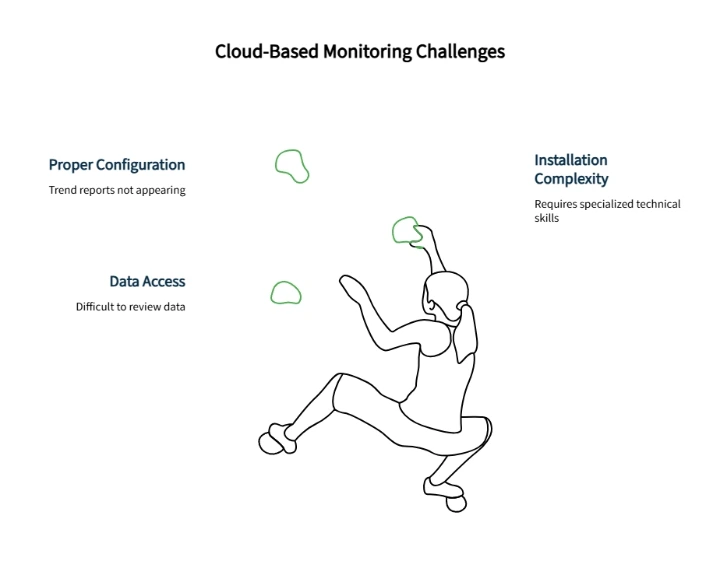
The operational shift from reactive repairs to preventative maintenance requires consistent access to pump trend data in a format that supports review without specialized technical skills. Cloud Based Wastewater Monitoring Systems automatically log pump runtimes, cycles, amp draw, GPM, and wet well levels — then present that history as graphical trends accessible through a browser or mobile app.
OmniSite's lift station monitoring devices — the Crystal Ball Plus and the XR50 — are the hardware layer that makes this possible. The Crystal Ball Plus records pump amp history, cycle history, runtime history, GPM history, well inflow rate and level history, and pump failure history for up to three pumps per station. The XR50 records pump runtimes, GPM, and on/off cycles and sends alarms by email, text, or voice call when conditions exceed configured thresholds. Both are described in OmniSite source documentation as SCADA replacements installable with basic wiring knowledge, featuring an internal battery that provides up to four hours of backup operation during a power loss.
GuardDog — OmniSite's secure, cloud-based notification system and historian, included free with every OmniSite device — is where operators review and act on that data. It provides graphical trend history, customizable callout lists, alarm acknowledgment, map view, historical reports exportable to Excel or Word, and up to six months of accessible history from any browser or the GuardDog 2 mobile app. The plug-and-play interface eliminates the need for custom programming.
The advanced pump trend reports — amp history, GPM history, runtime trends, and wet well level data — depend on proper installation. Amp probes, current switches, and applicable level transmitters must be correctly connected as specified in the installation documentation, and GuardDog must be configured with the appropriate callout lists and alarm settings. If trend reports are not appearing as expected, confirming the installation wiring is the right first troubleshooting step.
What About Cellular Reliability and Cloud Security?
Municipal utility teams evaluating a transition from legacy hardwired telemetry reasonably ask about cellular reliability and cloud security. These are legitimate operational questions, and it is worth addressing them directly.
On cellular reliability: OmniSite devices include an on-board backup battery that allows the system to continue monitoring and sending alerts during AC power loss. Cellular signal strength is displayed on the device itself, facilitating accurate antenna placement during installation. Data logging continues on-board through connectivity interruptions. These capabilities are documented in OmniSite product specifications.
On cloud security: GuardDog connections use Transport Layer Security (TLS) protocols from the device through the cellular network to OmniSite's servers. The OmniBeacon engineering specification also notes an SMS fallback mode — if the device cannot reach OmniSite's GuardDog servers for over 30 minutes, it delivers alarm notifications directly via text message without relying on the central server.
Cybersecurity should also be treated as an ongoing operational responsibility. CISA's water and wastewater cybersecurity resources note that the sector depends on digital systems for monitoring and operations. NIST's Cybersecurity Framework gives critical infrastructure organizations a common language for managing cybersecurity risk. For lift station monitoring, that means asking clear questions about access, configuration, notifications, vendor support, and internal procedures — and not assuming any platform removes all risk.
On system complexity: GuardDog is described in OmniSite product documentation as a plug-and-play interface that eliminates the need for custom programming. OmniAdvantage plan members receive free GuardDog setup assistance and professional operator training. Teams with specific coverage or security requirements should confirm details with an OmniSite representative before finalizing a deployment plan.
Pump Health Cheatsheet: 3 Data Trends That Deserve a Second Look
Data Trend | What It May Mean | What to Check Next | What Not to Assume |
|---|---|---|---|
Amp draw rising gradually over weeks | Motor working harder than baseline — possible wear, friction, or partial obstruction | Compare the pump's own amp history; inspect for clogging or mechanical drag | A gradual rise warrants a scheduled inspection, not an emergency response |
Sudden amp spike in one or more cycles | Acute blockage or debris reaching the impeller | Inspect and clean the pump; check wet well for rags or solids | One spike does not confirm failure — recurring spikes indicate intake protection needs attention |
Runtime increasing without clear inflow change | Reduced pump efficiency, impeller wear, or check valve issue | Compare runtime trend over 30–60 days; cross-reference with inflow and paired pump data | Do not assume longer runtime is seasonal variation without reviewing inflow data first |
Cycle frequency increasing unexpectedly | Float or level control issue, pump capacity loss, or elevated inflow | Check level control settings, float positions, and inflow rate | Not every cycle increase is a pump problem — verify inflow conditions first |
Total gallons per cycle decreasing | Wear ring damage, impeller degradation, or air entrainment | Evaluate the trend across multiple cycles before scheduling inspection | A single low-GPM reading may be a measurement artifact |
Wet well draining more slowly than baseline | Pump capacity loss or inflow rate change | Cross-reference pump runtime and cycle history with inflow data | Slower drainage alone does not confirm pump failure |
Trend anomalies do not automatically prove failure. They tell your team where to inspect first.
Frequently Asked Questions
Does high amp draw always mean the pump is failing?
No. It means the pump may be working harder than its established baseline. Compare the current pattern against the pump's own amp history and review paired pump data where applicable. A single elevated reading in isolation is different from a sustained trend across several reporting periods. One is a data point; the other is a pattern worth investigating.
What if the pump still runs but the trend looks worse?
That is exactly when trend monitoring is most useful. A pump can still run while becoming less efficient, more stressed, or more likely to need inspection. A running pump is not always a healthy pump. The trend data is the earlier signal — waiting for the pump to stop running means waiting for a more expensive problem.
What if only one pump in a duplex station changes behavior?
Treat the difference as a diagnostic clue. Comparing runtime, cycles, amp behavior, and GPM between the two pumps before assuming either a pump-specific failure or a station-wide flow problem is the most efficient diagnostic path. If Pump 1 trends are stable and Pump 2 trends are deteriorating, the data strongly suggests a Pump 2-specific issue rather than a shared inflow change that would affect both equally.
How often should the team review trends if alarms are already configured?
Alarms and trend reviews serve different functions. Alarms fire when a threshold is crossed; trends reveal directional change before any threshold is reached. The appropriate review frequency depends on station criticality, reporting package, and the utility's maintenance program. Higher-criticality stations — those with a history of overflows, aging equipment, or serving dense areas — warrant more frequent attention than lower-risk locations. Alarms are not a substitute for trend review. They are part of the same protection strategy.
When should trend data trigger a technician visit?
A consistent directional change across at least three consecutive reporting periods, without an obvious operational explanation such as a major rain event or recent maintenance, is a reasonable basis for scheduling an inspection. The trend does not confirm what is wrong — it confirms that something is worth verifying in the field. The key is to avoid waiting until the only available decision is emergency response.
From Reactive Repairs to Preventative Maintenance
Most lift station failures that result in overflows, regulatory notices, or emergency repair costs have a data trail that preceded them. The amp draw was climbing. The runtime was extending past its normal band. The GPM was drifting downward. The danger of reactive maintenance is that operations teams consistently encounter the consequence before they have the information to prevent it.
The U.S. EPA's guidance on collection and lift station maintenance frames proactive maintenance as a core strategy for reducing sanitary sewer overflow risk. The EPA's CMOM program guidance for sanitary sewer collection systems similarly emphasizes that proactive operation and maintenance programs are foundational to reducing overflow events and regulatory exposure. Neither framework requires operators to predict every failure. Both require that operators have the data and processes to act on warning signs before conditions deteriorate.
Wastewater monitoring that surfaces trend history — rather than only alarm states — is the practical tool that makes this achievable for teams managing multiple stations with limited field resources. When the trend data is visible, accessible, and reviewed consistently, the decision to dispatch a technician for an inspection becomes straightforward rather than reactive. The pump is telling you what it needs. The monitoring system makes that message readable.
The next step after establishing trend visibility is building redundancy into the monitoring architecture itself. How to build a fail-safe wet well monitoring strategy in 3 steps is a practical guide to that next phase of infrastructure stewardship. To discuss whether your current setup is capturing the pump trend data described here, contact us — the OmniSite team can help assess what your system is and is not logging today.
Disclaimer: This article is for general educational purposes only and is not a substitute for site-specific engineering judgment, equipment inspection, operator training, regulatory guidance, or professional maintenance advice. Pump data trends can help teams identify patterns worth investigating, but they do not guarantee failure prediction, overflow prevention, or regulatory compliance. Individual applications vary, and operators should evaluate equipment, alarms, communications, and maintenance practices for their specific lift station conditions.
Our Editorial Process:
OmniSite content is developed from approved strategy documents, product source materials, and relevant industry context. Drafts are checked against OmniSite source documents for product accuracy, reviewed for unsupported technical or regulatory claims, verified for citation integrity, and edited for clear Grade 8–9 readability. Any product-specific statement must be traceable to OmniSite materials. Any industry-wide claim is supported by authoritative external sources when used. Our expert team uses AI tools to help organize and structure our initial drafts. Every piece is then extensively rewritten, fact-checked, and enriched with first-hand insights and experiences by expert humans on our Insights Team to ensure accuracy and clarity.
About the OmniSite Insights Team:
The OmniSite Insights Team is our dedicated engine for synthesizing complex topics into clear, helpful guides. While our content is thoroughly reviewed for clarity and accuracy, it is for informational purposes and should not replace professional advice.